About the Course
Diagrams and Visual Thinking is a graduate-level seminar in the Communication, Culture, & Technology (CCT) program at Georgetown University. During the course, students explore diagrams and visual models as a unique communicative form that combines text, image, and elements of graphic design. Students also design diagrams using Stuck? Diagrams Help by information architect Abby Covert. Course readings and discussions examine diagrams from a variety of interdisciplinary perspectives, including communication theory, cognitive science, graphic design, art history, anthropology, and sociology. Throughout the course, we interrogate what is and is not a diagram, how diagrams communicate, and techniques of diagram design. This year, a particular focus arose regarding the distinction between generative and representational diagrams. This website, with its collection of over 200 diagrams, is the result of our collaborative journey. The site is built upon the Omeka S content management platform, and student contributions included historical and archival research, aesthetic analysis, web design, data architecture, and coding. A diagrammatic representation of the course structure can be viewed here.

Kunjika Apurvahbai is a first year CCT student from India who loves to talk to new people and tell stories in a slightly exaggerated manner. Her interests include cultural studies, food, design and narrative building. She likes to read and cook (without a recipe) in her free time. Kunjika worked on a exhibit on food with her colleague, which explores nutritional and cultural aspects of recipes. Her individual diagram contributions speak to her interests in cultural studies and storytelling. Furthermore, her favorite diagram is the one explaining the science of heat and spice particularly because it is creatively crafted in the shape of a face while retaining its diagrammatic qualities of usefulness through elements such as connecting lines. View LinkedIn profile

Zhaoxu Shirley Chen is a second-year graduate student in the Communication, Culture & Technology program at Georgetown University. Her interests include narrative theory, linguistics, and design. Shirley is a member of the web design team, and is in charge of the data visualization page (collaborating with the coding team), the faceted browse page, and helps exhibitors to achieve several animation effects. Her favorite diagrams are The Semiotic Square and The Central Features of Conceptual Integration. View LinkedIn profile .
Steve Fernie is the Web Services Coordinator at Georgetown University Library and assisted with the development of the Diagrammatica site as part of the Digital Research and Innovation (DRI) program. He bakes and bikes, and is known for his obsessions with author Kim Stanley Robinson, vocal group The Delta Rhythm Boys, and the revenue stamps of Lithuania. He couldn't possibly pick a favorite diagram.

Joe Gurr is a student at Georgetown University. His interests include science communication, film, and storytelling. Joe contributed to the collections effort for the Diagrammatica site. His favorite diagram is the Artemis II Map, because who doesn't love a moon landing? View LinkedIn profile

Yilin Huang is an international student from China. Her interests include minimalist style, architecture, marketing, entrepreneurship etc,. For this website, Yilin Huang coded the collected diagrams by shape using a controlled vocabulary. This coding supported Visualizations of the Collection and the ability to explore the archive via Faceted Browsing. Her favorite diagram is Structure of Sign Operations. View Linkedin Profile

Shuxian (Shelly) Liu is a second-year CCT student. Her interests include the fan culture and entertainment industries of various countries, and strategies for fostering engagement within cultural communities. Her academic focus centers on identity within diverse communities this semester. Shelly works with a food and nutrition diagram exhibition, collecting diagrams from both nutrition and food perspectives, and analyzing them. Her favorite diagrams are "The Asian Food Guide Pyramid" and "What Should I Cook." Find on Instagram

Yiran (Errina) Ma is a graduate student in Communication, Culture & Technology at Georgetown University. Her interests include digital marketing, technology governance, and K-pop. Errina has facilitated communication among the exhibition creators and the tech team, supported the artistic design of the exhibition pages, and instructed the application of website-building tools. Her favorite diagrams are anthropology and communication diagrams. Find on LinkedIn

Yuwei Ma is a complex problem-solver with her quantitative and qualitative research and design skills. Her interests include misinformation research, future research, UX architecture, and human and technology interface. Yuwei is the project manager and UX designer for this website. She coordinated among the whole class and designed to establish the home page, all exhibition pages, and other new features. Her favorite diagram is the Economic Doughnut. This diagram tried to build a new paradigm of measuring and leading economic growth. The doughnut shape clearly demonstrated how to incorporate ecological limitations into an economic model. Find on LinkedIn

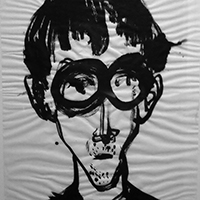
Riya Mittal is a visual learner who enjoys artist books and alternative reading practices. Her academic interests include working on her Dyslex-Aid software, delving into deblackboxing technologies, and exploring how diagrams can aid students with learning disabilities. Riya contributed to the course website by providing multiple diagrams that enhance our understanding of learning disabilities. Additionally, she curated an exhibit on Julie Chen and her artist books, which resulted in the acquisition of two of Chen's books by Georgetown's Booth Center for Special Collections. Riya's favorite diagram appears in Chen's Book of Hours. This particular diagram showcases how data visualization and other generative diagrams can contribute to a deeper understanding of the COVID-19 pandemic. Riya finds this diagram particularly impactful as it exemplifies the potential of visual aids in conveying complex information. View Riya's homepage.

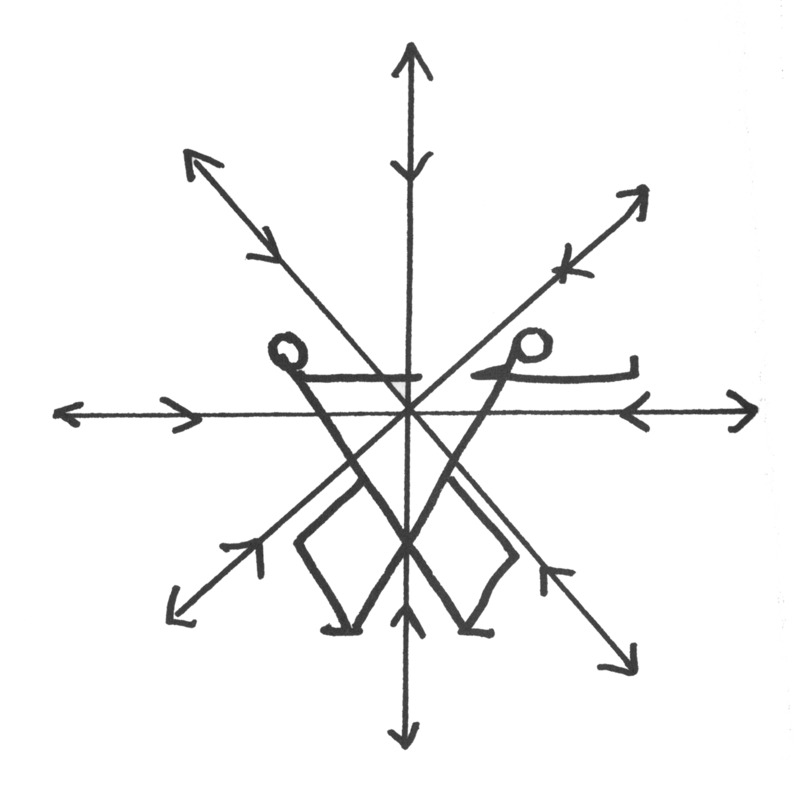
Ali Noia an aspiring journalist with a passion for both written and visual storytelling. Her academic interests include feminism and gender theory, Marxism, narrative writing, and art. Her two favorite diagrams on the database are Feminist Tactical Strategy: A Diagrammatical Series and Identity Performance. She has deeply enjoyed exploring feminism expressed through diagrams while taking Diagrams and Visual Thinking.
J.R. Osborn is an Associate Professor of Communication, Culture & Technology at Georgetown University. His interests include semiotics, histories of graphic design, museum studies, and diagrammatics. J.R. was the course professor for Diagrams and Visual Thinking 2023 and oversaw the development of the website. His favorite diagrams are: The Semiotic Square and Charles Sander Peirce's Triple Facts.
Jiayue "Quinn" Ran (she/her) is pursuing an M.A. in Communication, Culture, and Technology at Georgetown University, where she is expanding her interests which include but are not limited to remix experiments, diagram and visual thinking, and graphic design. Her favorite types of diagrams are generative diagrams, since she can always learn new things from them. Find on LinkedIn

Steve Wang is a photographer and artist. His interests include wet-plate photography, modern architecture, and Romanticism. Steve curated the exhibition of A Brief History of Architectural Diagram. His favorite diagram is "The older you get, the farther from the camera you need to be.", which is the first published picture of camera obscura. View Steve's portfolio.

Jing Xiao is a second-year Communication, Culture, & Technology graduate student on her way to becoming a tech storyteller. Her interests include filmmaking, AI, intercultural communication, and branding. Jing takes charge of the story structure exhibit. Her favorite diagram is Gender as Structure. Find on LinkedIn.

Xinyue Yao is a student in the Communication, Culture & Technology graduate program at Georgetown University, class of 2024. Her interests include branding, integrated marketing, and artificial intelligence. Xinyue is a member of the website design team, responsible for the communication of the uniqueness of exhibition page, and she also have their own diagram exhibition page about branding. Xinyue's favorite diagram is the Design ROI Framework, as it represents a three-dimensional model that represents the different benefits of design in a business context. Find on Instagram

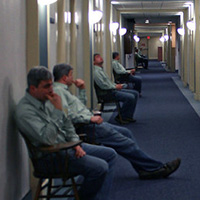
Yuan Yao enjoys exploring the relationship between individuals, organizations, and society, and she curated the exhibition on this topic. Her interests include analyzing how social behavior can help individuals and businesses become more successful and applying her studies to make her work more efficient. She also likes drawing and singing. Yuan's favorite diagram is The Individual in Organization or Society because everyone in society struggles with conformity and rebellion, and she can find resonance in this diagram. View her portfolio.

Jamie Zhang is a graphic designer and photographer. Her interests include social media studies, traveling, and experimenting with different art formats. She is responsible for the UI/UX design of the Diagrammatic website. Jamie's favorite diagrams are Interaction and Correspondence and Foucault's Great Fiction. View on LinkedIn

Joyce Zhao is a first year MA student in the Communication, Culture & Technology graduate program at Georgetown University and an aspiring historian of technology. Her interests include modern American technology, Silicon Valley, and tech labor. Joyce curated an exhibit on hand diagrams as material anchors after visiting Special Collections at Georgetown. Her favorite diagram is Bruno Latour's The Two Great Divides because she loves thinking about the Nature/Culture divide and Latour. View on LinkedIn